Understanding DISC Profile – DISC Personality Test Basic and Adapted Styles
After you take the DISC Profile, you will see your type expressed in two graphs: Graph I and Graph II.
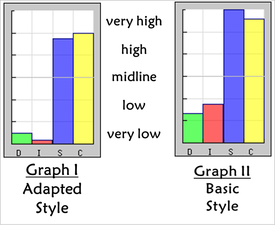
DISC Test Graph II: Basic Style is based on your “least choices,” and reflects the real you, your “sweet spot.” The theory is we feel more strongly about what we do not like than what we like, and these dislikes do not change that often. So our “least” preferences probably reflect more of our core self. Graph II is used to identify your basic DISC personality style.
DISC Assessment Graph I: Adapted Style is based on your “most choices” or positive preferences. Since your positive preferences may fluctuate according to the circumstances, these scores reflect how you tend to adjust to your environment, thus the Adapted style. This is the behavior others are most likely to observe.
It is helpful to compare the two graphs. If there is strong similarity between Graphs I & II, you probably feel quite comfortable being yourself (Graph II) in your environment (Graph I). If there is great variance between Graphs I and II, something in your environment (Graph I) is motivating you to elevate and/or minimize aspects of your basic style (Graph II).
In the sample graph above, there is a strong similarity between Graphs I and II, but there are some differences. Both are high or very high in S and C. In Graph II, however, there are I and D tendencies, although low. But these are muted in Graph I. This means there is something in the environment (Graph I) that motivates them to minimize their D and I traits (Graph II).
To understand how the four types blend together to make up one’s DISC personality style, see the next article on DISC Profile Blends.